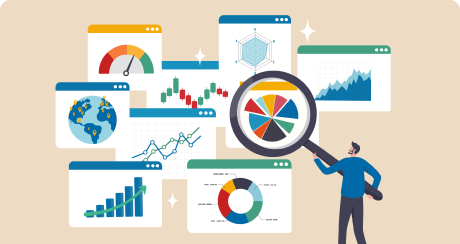
Make sense of your data with intuitive dashboards, dynamic graphs, and powerful reporting tools that bring together information from multiple sources into one easy-to-use platform.

Our data visualization solutions turn raw numbers into meaningful visuals that drive smarter decisions and strategic growth.

See the metrics that matter most with dashboards tailored to your specific business needs, giving you real-time insights at a glance.

Our graphing tools help you spot trends, identify opportunities, and make data-driven decisions with confidence.

Generate detailed reports that break down complex data into clear, actionable insights, making it easier to communicate results across your team.

Combine data from various systems into a single view, making it easier to understand your entire business.

Explore your data with charts that allow you to drill down into specifics and see the bigger picture.

Save time with reports that are automatically generated and delivered to your team on a regular schedule.

Our dashboards are designed with usability in mind, making it simple for your team to access and understand key insights.

Stay on top of your data with real-time dashboards that reflect the latest numbers and trends.

See the data that matters most to you with customizable filters and views, ensuring you have the right information at your fingertips.
Complement your data visualization tools with services that ensure your data is accurate and your insights are actionable.

Our custom software solutions bring together data from all your systems, creating a unified platform for reporting and analysis.

Let our experts help you make sense of your visualized data, providing strategic recommendations based on trends and patterns.
Data visualization turns complex data into easy-to-understand visuals like charts and dashboards, making it easier to see trends and make informed decisions.
Yes, we specialize in combining data from various platforms into a single dashboard, giving you a comprehensive view of your business.
Custom dashboards are designed around your specific needs, allowing you to see the metrics that matter most in real-time, with interactive charts for deeper insights.
Our dashboards can be configured for real-time updates or on a schedule that fits your needs, ensuring you always have the latest data.
Yes, we offer training and support to ensure your team can confidently use and navigate your new dashboards and reporting tools.


Curious to see if we're a good fit? Schedule a call, and together, let's explore the possibilities

Once we understand your vision, the fun begins! Let's dive into a brainstorming session and craft the perfect solution to bring your ideas to life.

Our collaborative approach seamlessly blends the personal touch of weekly one-on-one meetings with the efficiency of online tools.

Our process is all about transparency and excellence. We incorporate testing at every stage, providing clients with direct access to evaluate progress.

Our commitment extends beyond project completion, ensuring your digital presence stays secure, efficient, and seamlessly supported over the long haul.